Peakboard Digital Signage Platform
In the autumn of 2015 I started designing and developing the Peakboard digital Signage platform. The system comprises of two parts: A WPF designer and the Universal Windows Platform (UWP) runtime application. The Peakboard-Box (hardware) is running Windows 10 IoT with the runtime application that is connected with the display using a HDMI cable.
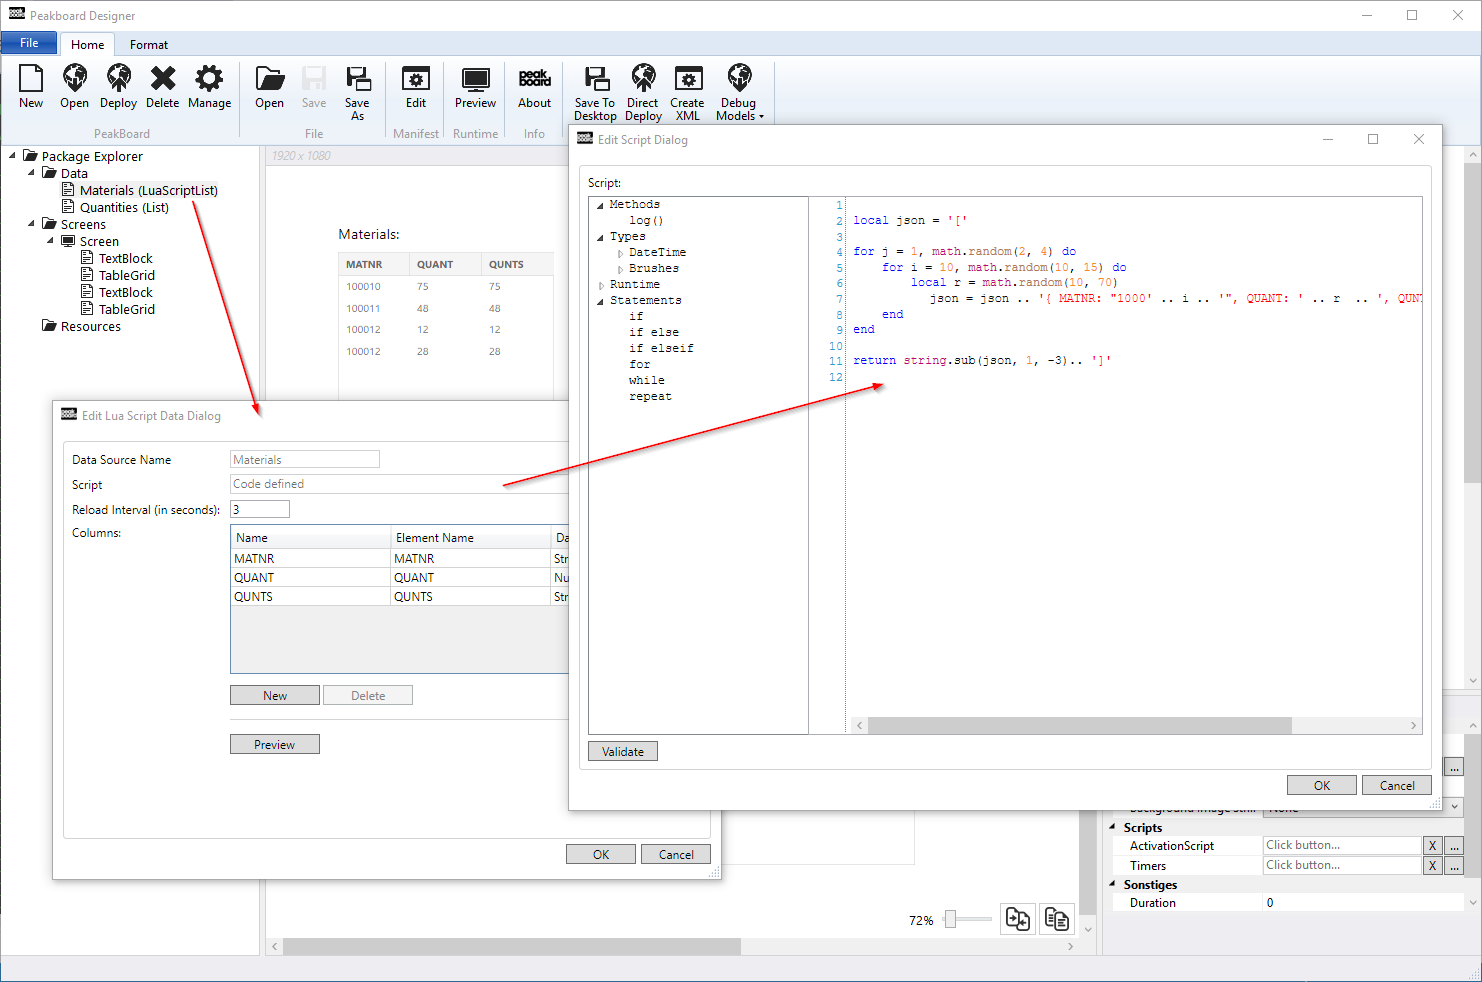
The Peakboard system visualizes complex data sources in real-time, allowing customers to easily create and manage digital signage display units using a number of controls provided by the designer to communicate all kind of data driven information. The boards running on the devices are generated by designer and can also be scripted using the very powerful Lua scripting language.
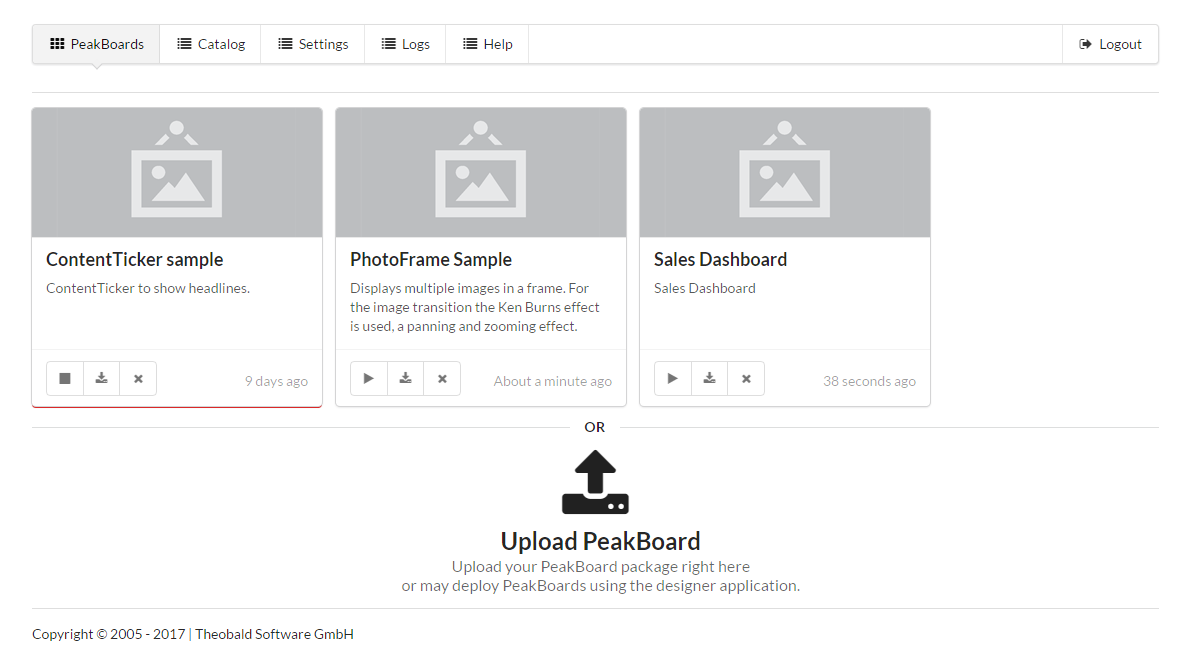
For the runtime I have developed a custom web server and administration website to upload and manage Peakboard packages containing the board and all of it's screen definitions and resource files. Each board is packaged in a ZIP file with the .pbmxpackage file extension and can be directly deployed from the Peakboard designer application.
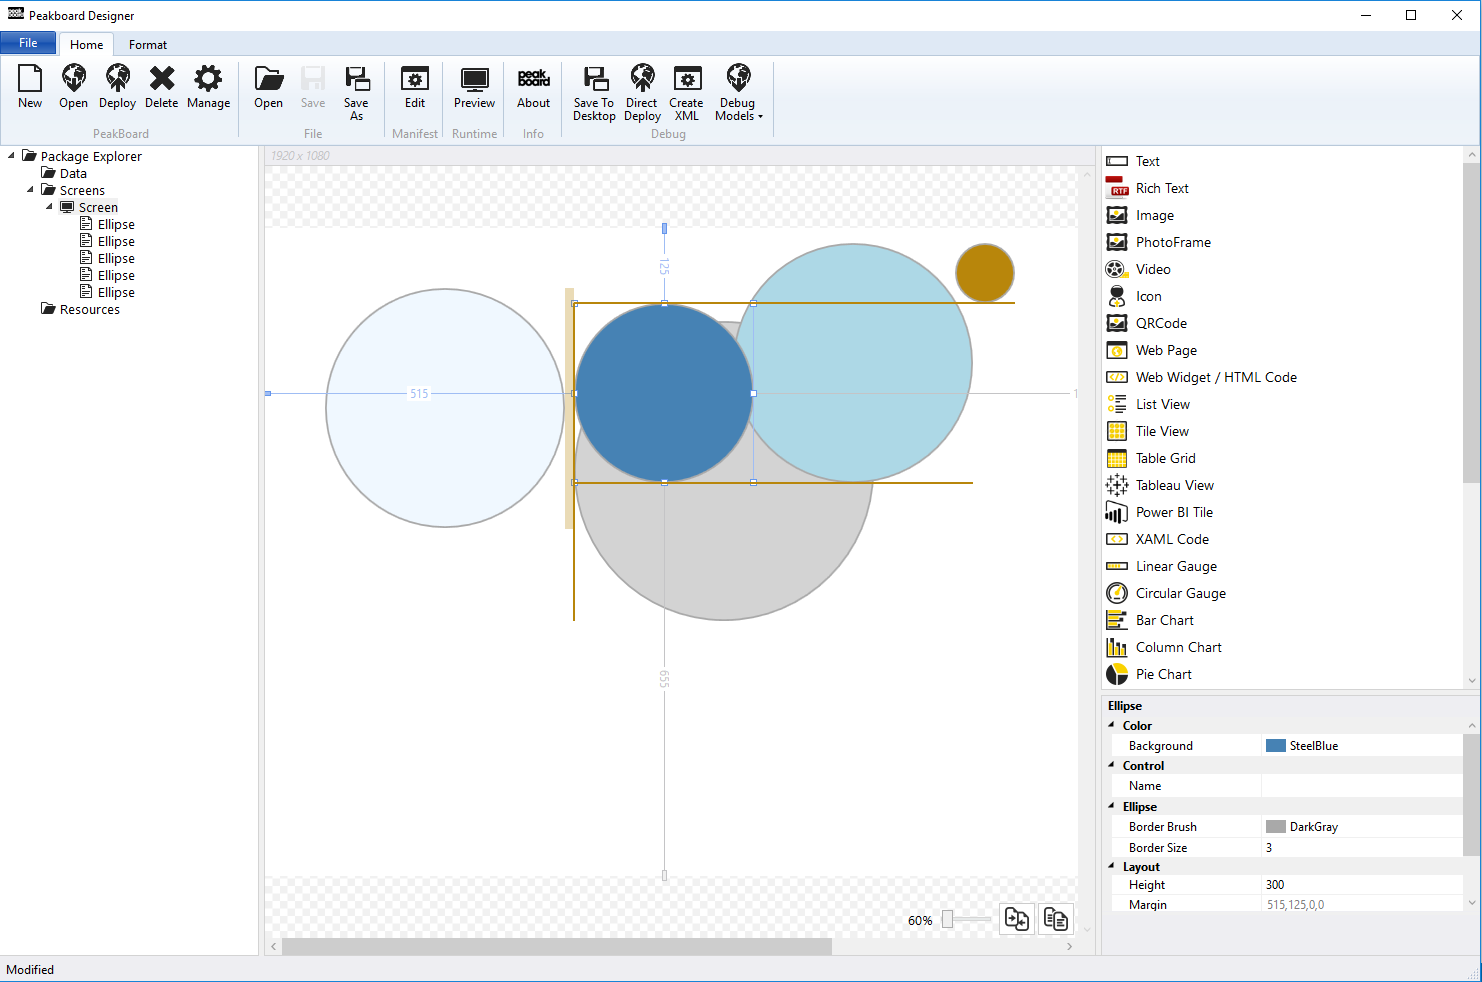
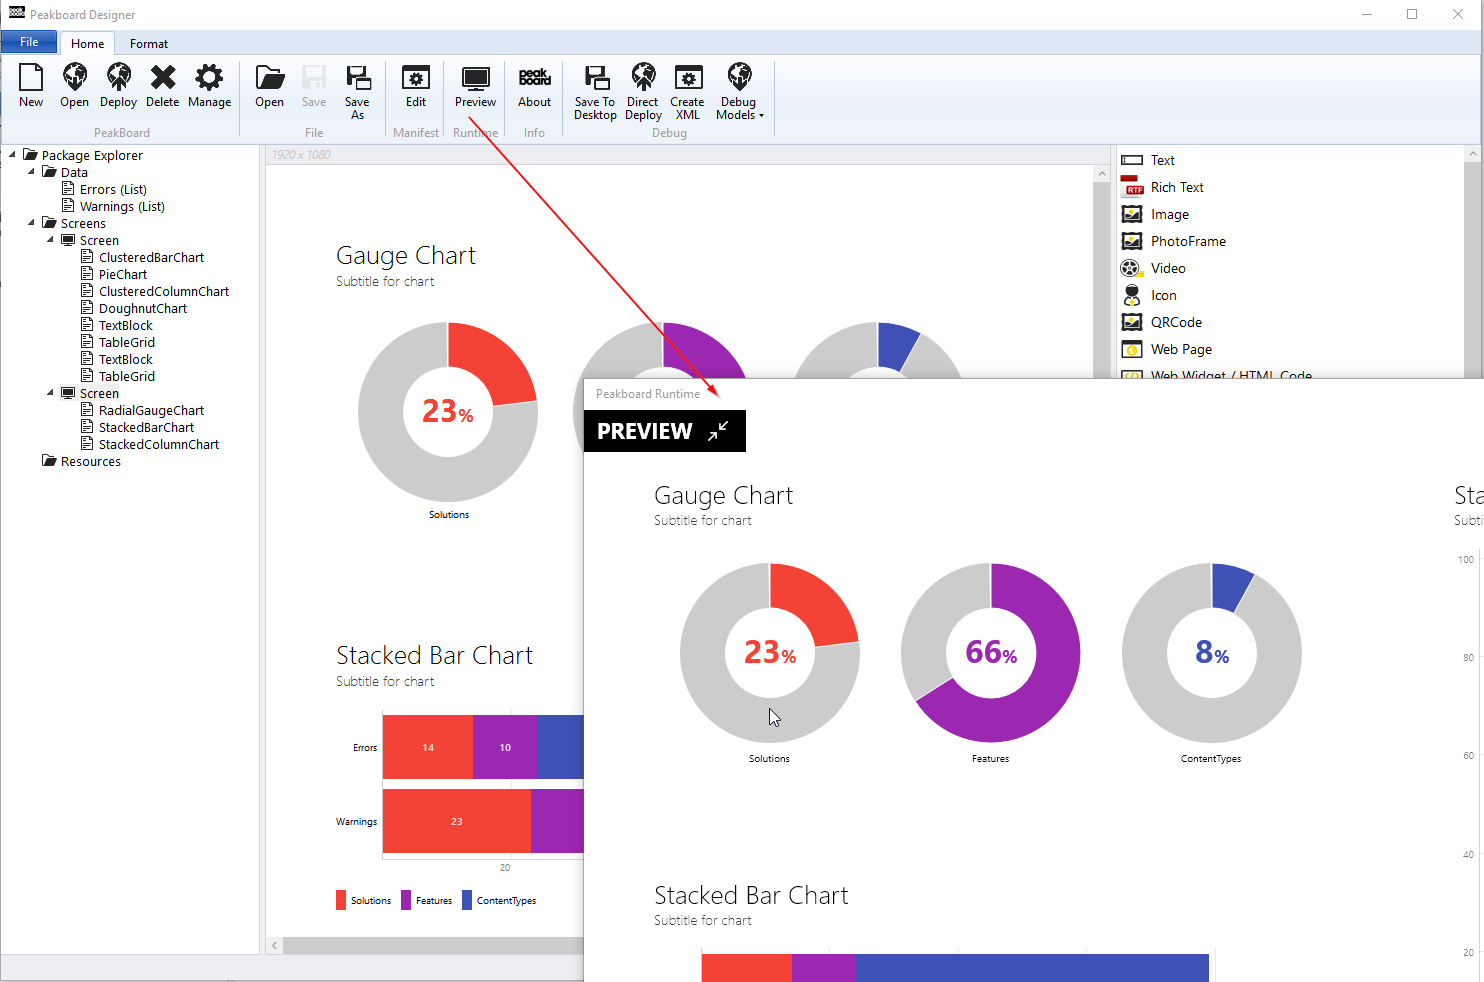
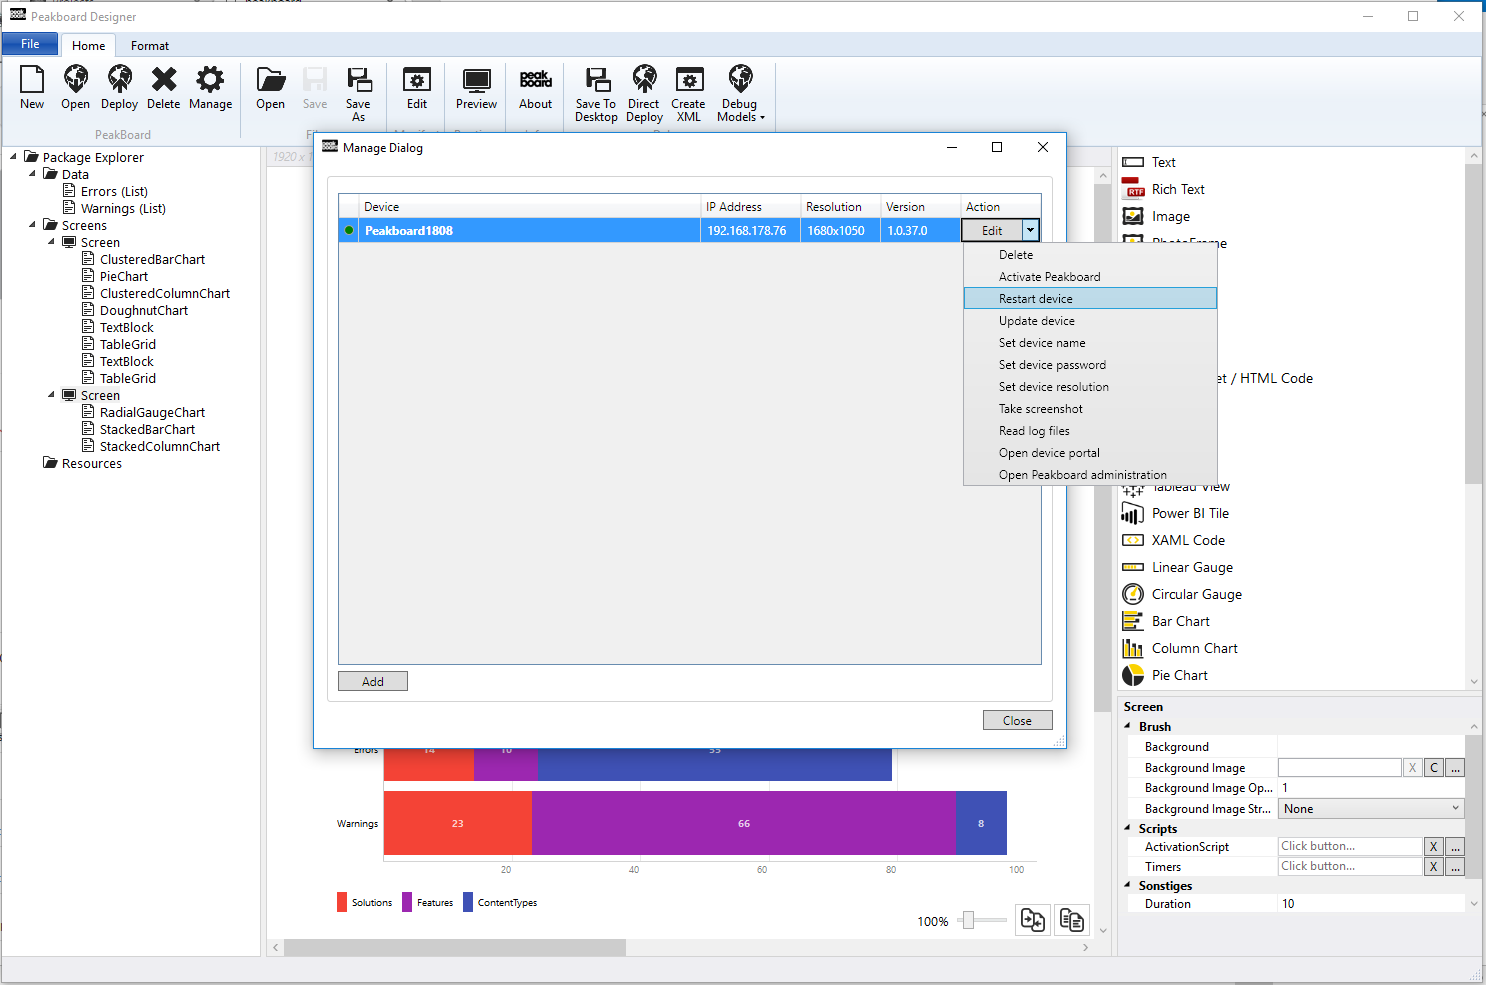
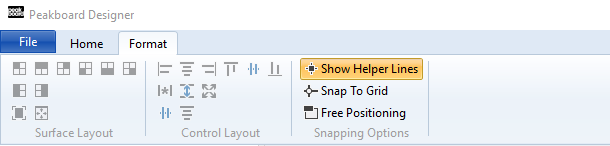
The designer consists of the following powerful features:
- Number of different and complex data sources
- Number of different visualization controls
- Board preview (Windows 10 required)
- Board deployment
- Device management
- Lua Scripting
- Animation
- Distance and margin lines
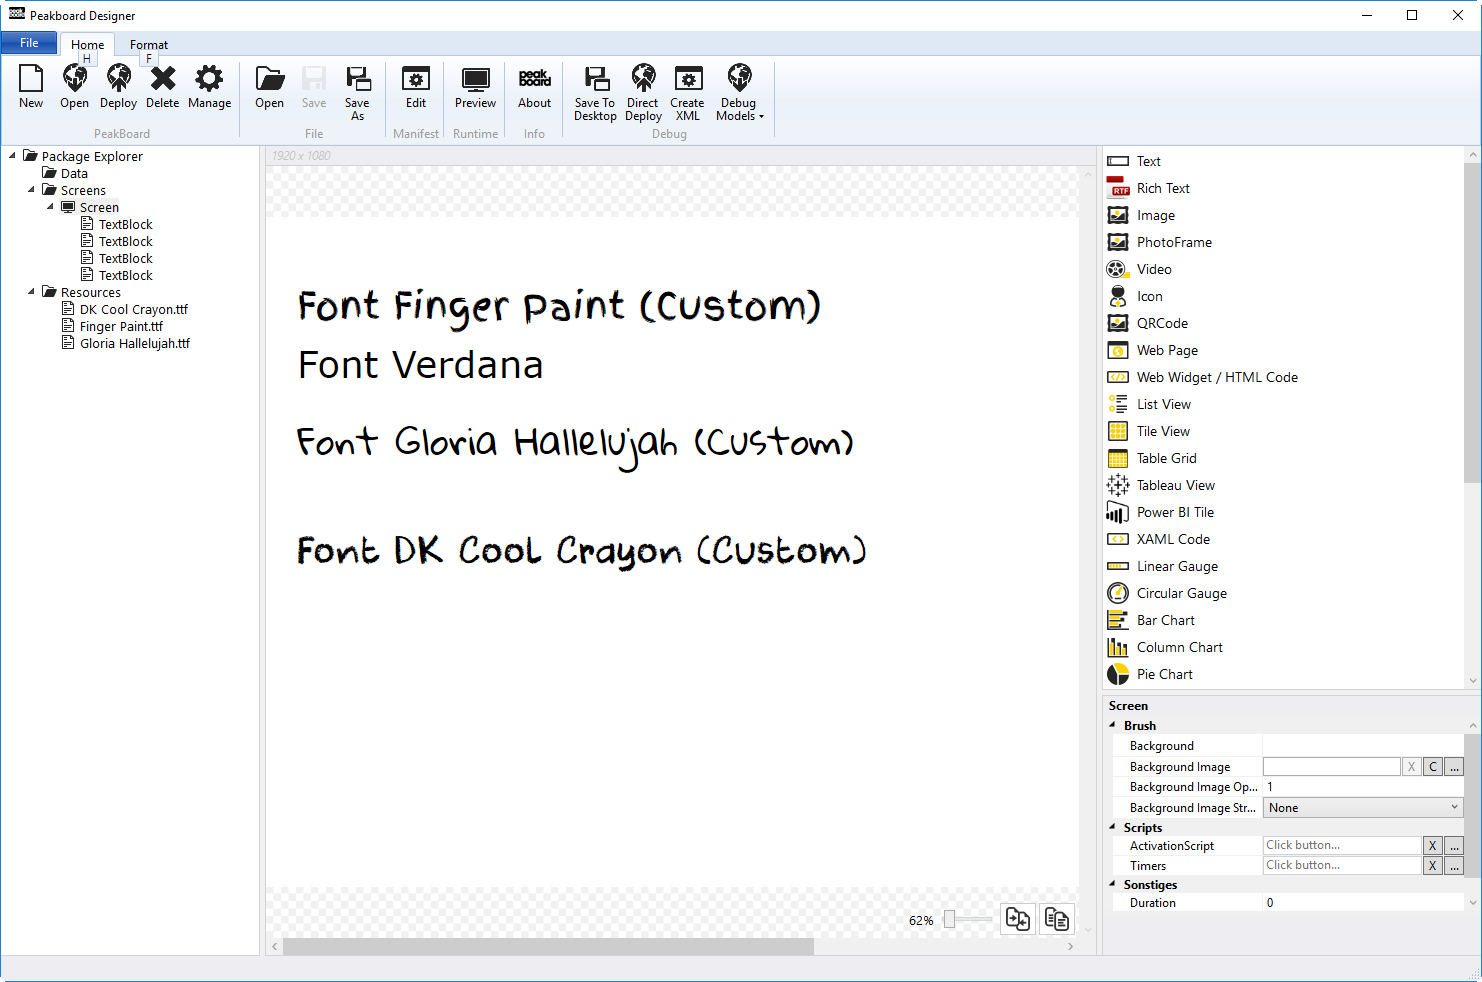
- Layout and format features
- Property Grid
- Modern UI interface (Ribbon Bar)
The following data sources are currently provided (as of January 2017) by the designer:
- JSON
- XML
- OData
- Feed
- Table
- SAP
- Lua Script
- Dropbox
- Google Drive
- Azure SQL
- Webpage
- Dynamics NAV
- Primitive Values
The following controls are currently provided (as of January 2017) by the designer:
- Text
- Rich Text
- Image
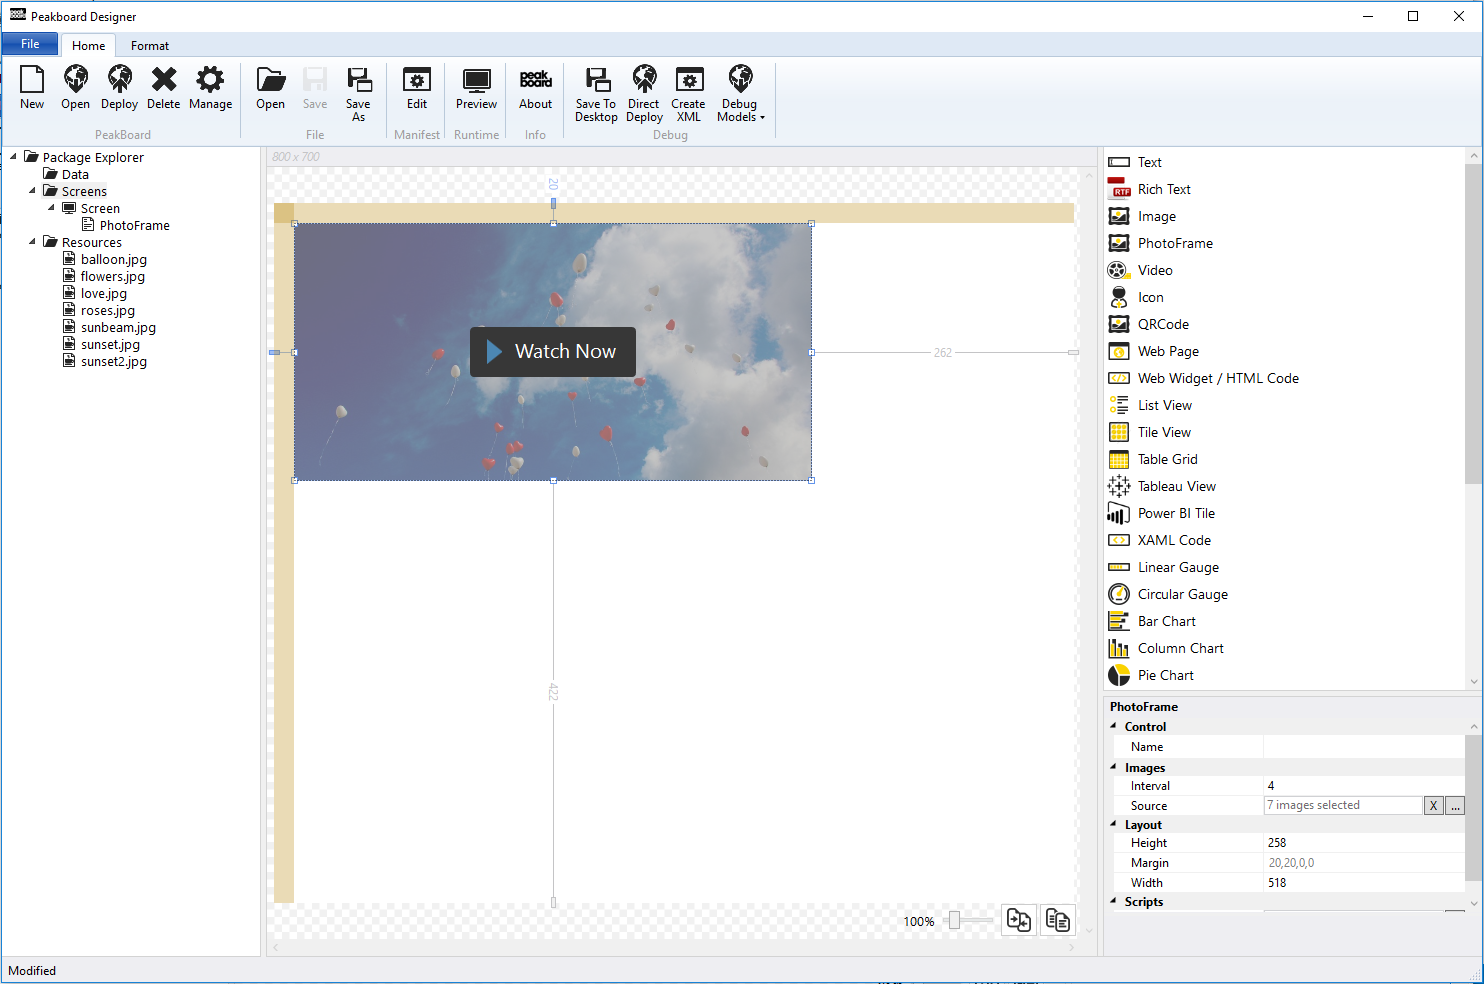
- PhotoFrame (Image viewer using Ken Burns effect)
- Video
- Icon (with huge icon gallery)
- QRCode
- Webpage
- Web Widget (custom HTML code)
- List View
- Tile View
- Table Grid
- Tableau View
- Power BI Tile
- XAML Code
- Timeline Grid
- PDF Viewer
- Google Docs
- OneDrive
- ExcelViewer
- Shapes (rectangle, line, ellipse)
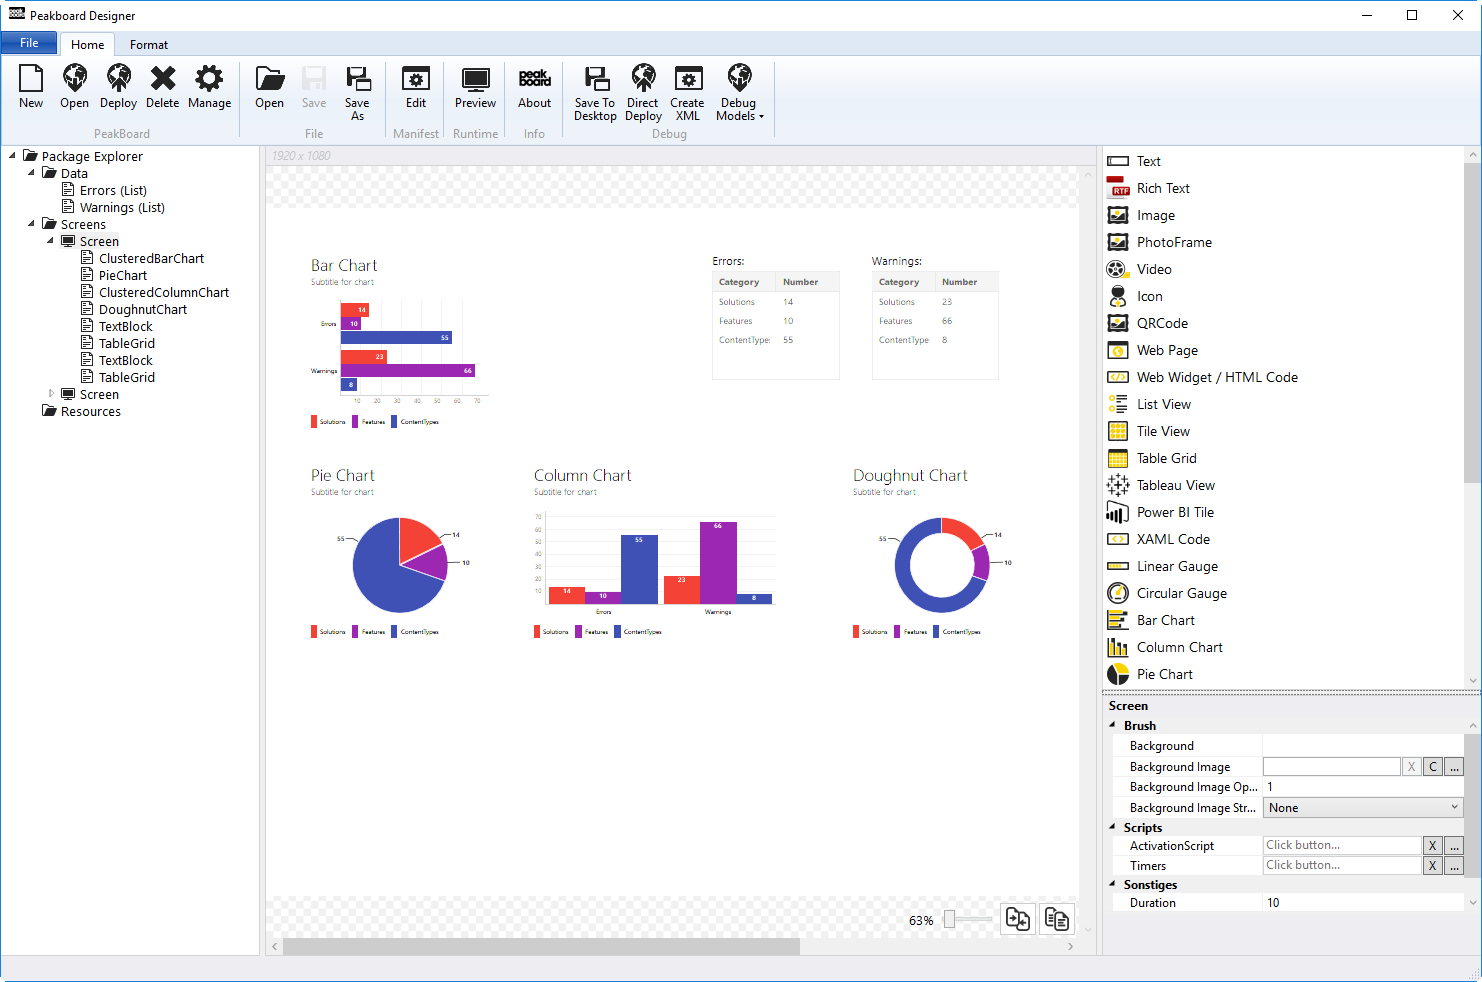
- Charting (linear and circular gauge, bar, column, pie, gauge, doughnut, stacked bar, stacked column chart)
The runtime consists of the following powerful features:
- XAML control infrastructure system
- Data Pushing API
- Administration API
- Administration website (using custom web server)
Feel free to contact me if you have questions about the Peakboard data driven digital signage system.